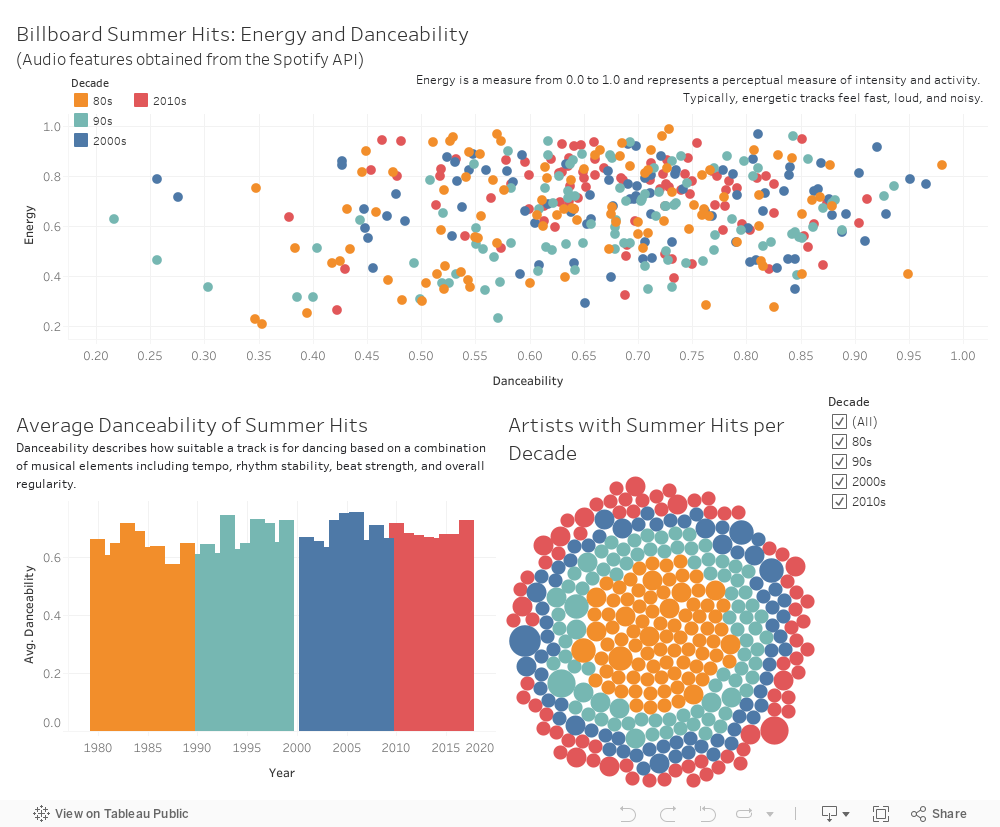
Billboard Summer Hits in the Last Decades
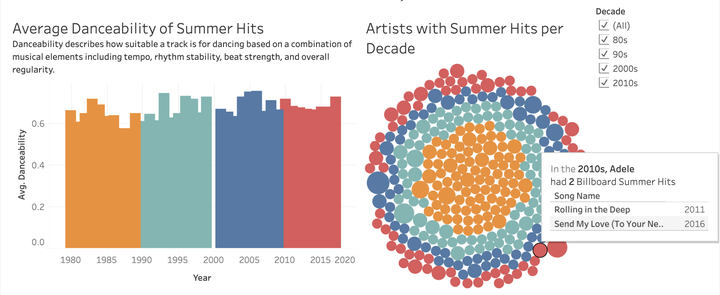 Tableau Dashboard
During our Data Wrangling and Exploratory Data Analysis course, R was used to demonstrate different concepts, exploring tools from dplyr, ggplot2, tidyr, lubridate, readr, and other modern packages for reporting and interactive visualizations.
As an additional example of other tools, a set of Tableau demonstrations were incorporated in our discussions. A follow-up course in Data Visualization and Reproducible Research is offered in the Fall 2020 semester.